This post is a continuation of my series about using Application Insights in ASP.NET Core. Today we will take a deeper dive into Request telemetry.
Request Telemetry
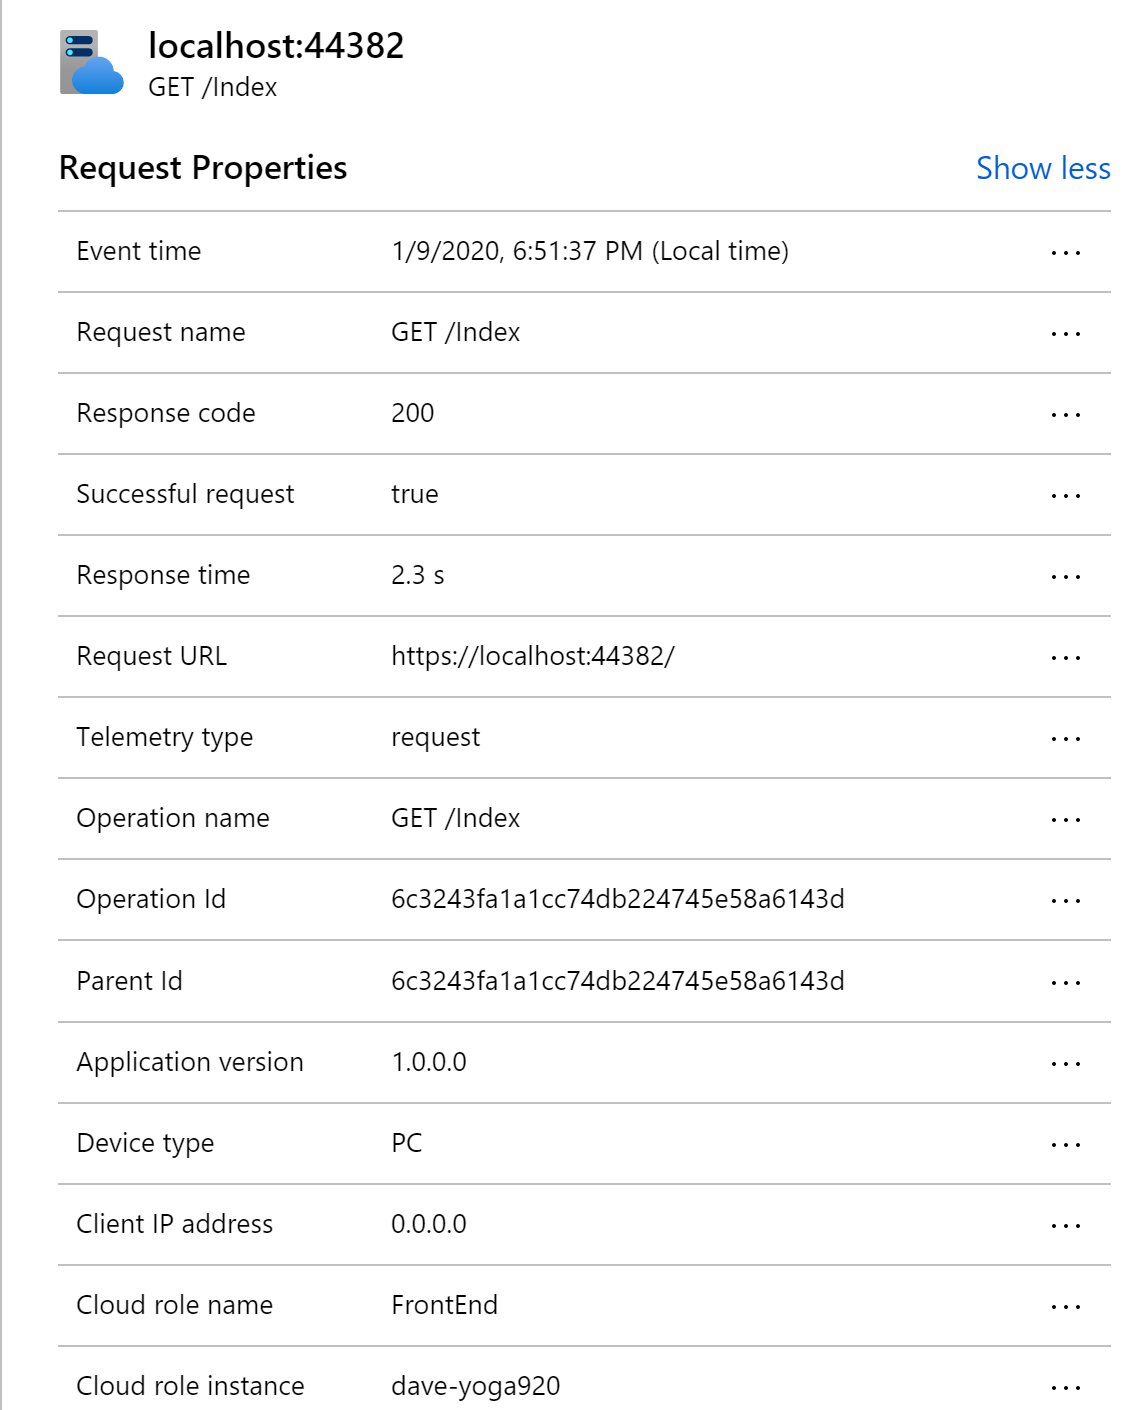
For an ASP.NET Core process, the Application Insights SDK will automatically collect data about every request that the server process receives. This specific type of telemetry is called Request telemetry and it contains a ton of very useful data including: the request path, the HTTP verb, the response status code, the duration, the timestamp when the request was received.
The default data is great, but I often find myself wanting more information. For example, in a multi-tenant application, it would be very useful to track the tenant id as part of the request telemetry. This would allow us to filter data more effectively in the Application Insights portal and craft some very useful log analytics queries.
Adding custom data to Request Telemetry
All types of telemetry in Application Insights provide an option to store custom properties. In the previous post, we saw how to create an ITelemetryInitializer to set properties on a particular telemetry instance. We could easily add custom properties to our Request telemetry using a telemetry initializer.
public class CustomPropertyTelemetryInitializer : ITelemetryInitializer |
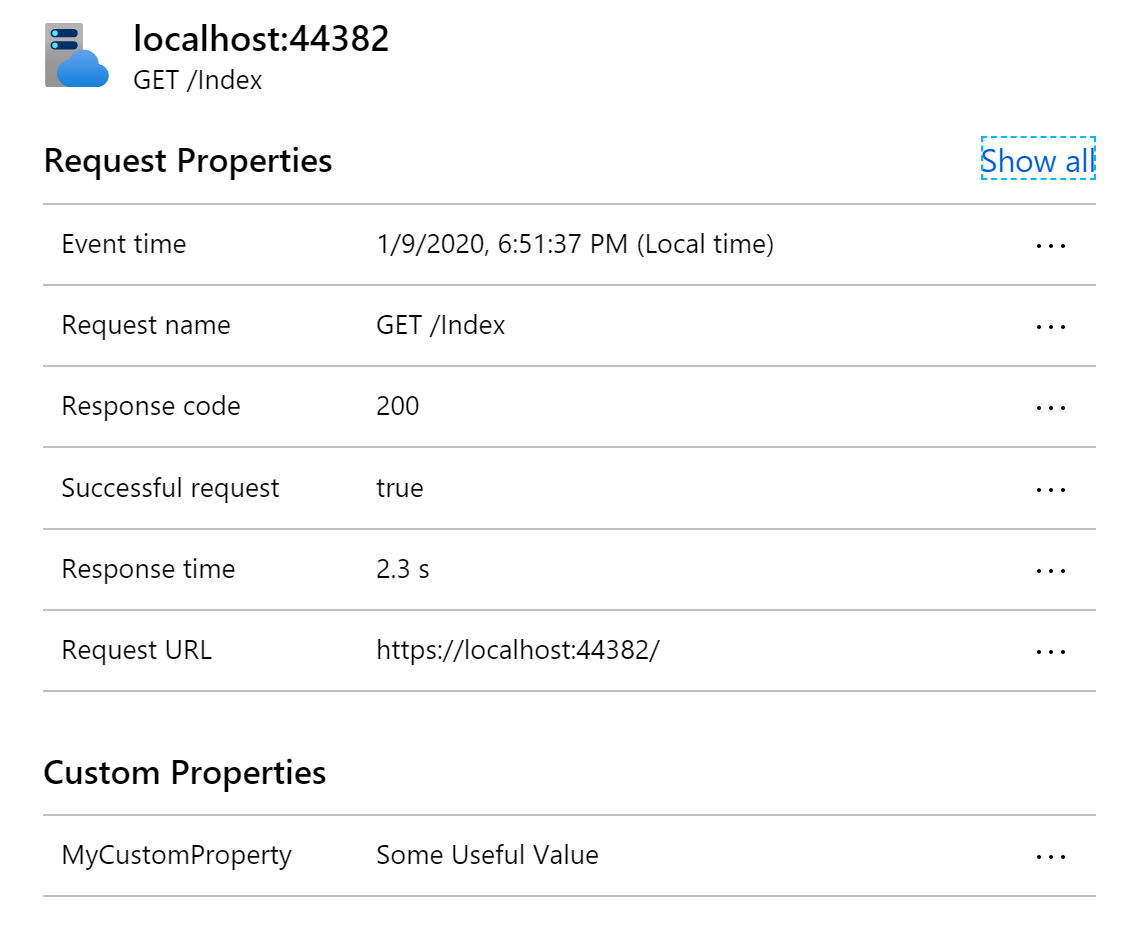
Any custom properties you add will be listed under Custom Properties in the Application Insights portal.
But telemetry initializers are singletons and often don’t have access to the useful data that we want to add to request telemetry. Typically the data we want is related in some way to the current request and that data wouldn’t be available in a singleton service. Fortunately, there is another easy way to get an instance of the request telemetry for the current request.
var requestTelemetry = HttpContext.Features.Get<RequestTelemetry>(); |
You can do it anywhere you have access to an HTTP Context. Some examples I have seen include: Middleware, ActionFilters, Controller action methods, OnActionExecuting in a base Controller class and PageModel classes in Razor Pages.
Filtering by Custom Properties in the Portal
Once you’ve added custom properties to Request Telemetry, you can use those custom properties to filter data in the Application Insights portal. For example, you might want to investigate failures that are occurring for a specific tenant or investigate performance for a particular tenant.
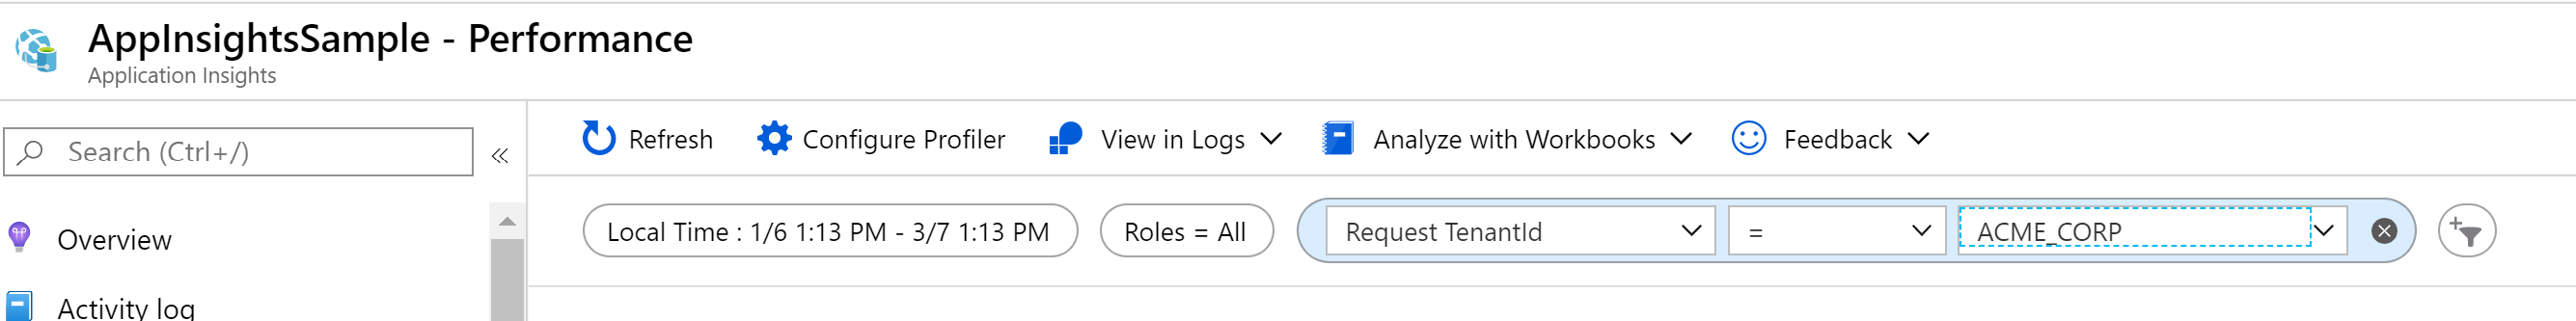
This type of filtering can be applied almost anywhere in the portal and can help narrow things down when investigating problems.
Writing Useful Log Analytics Queries
Now this is where things get really interesting for me. What if we had one particular tenant complaining about performance. Wouldn’t it be interesting to plot out the average request duration for all tenants? We can easily accomplish this using a log analytics query.
requests |
This simple query will produce the following chart:
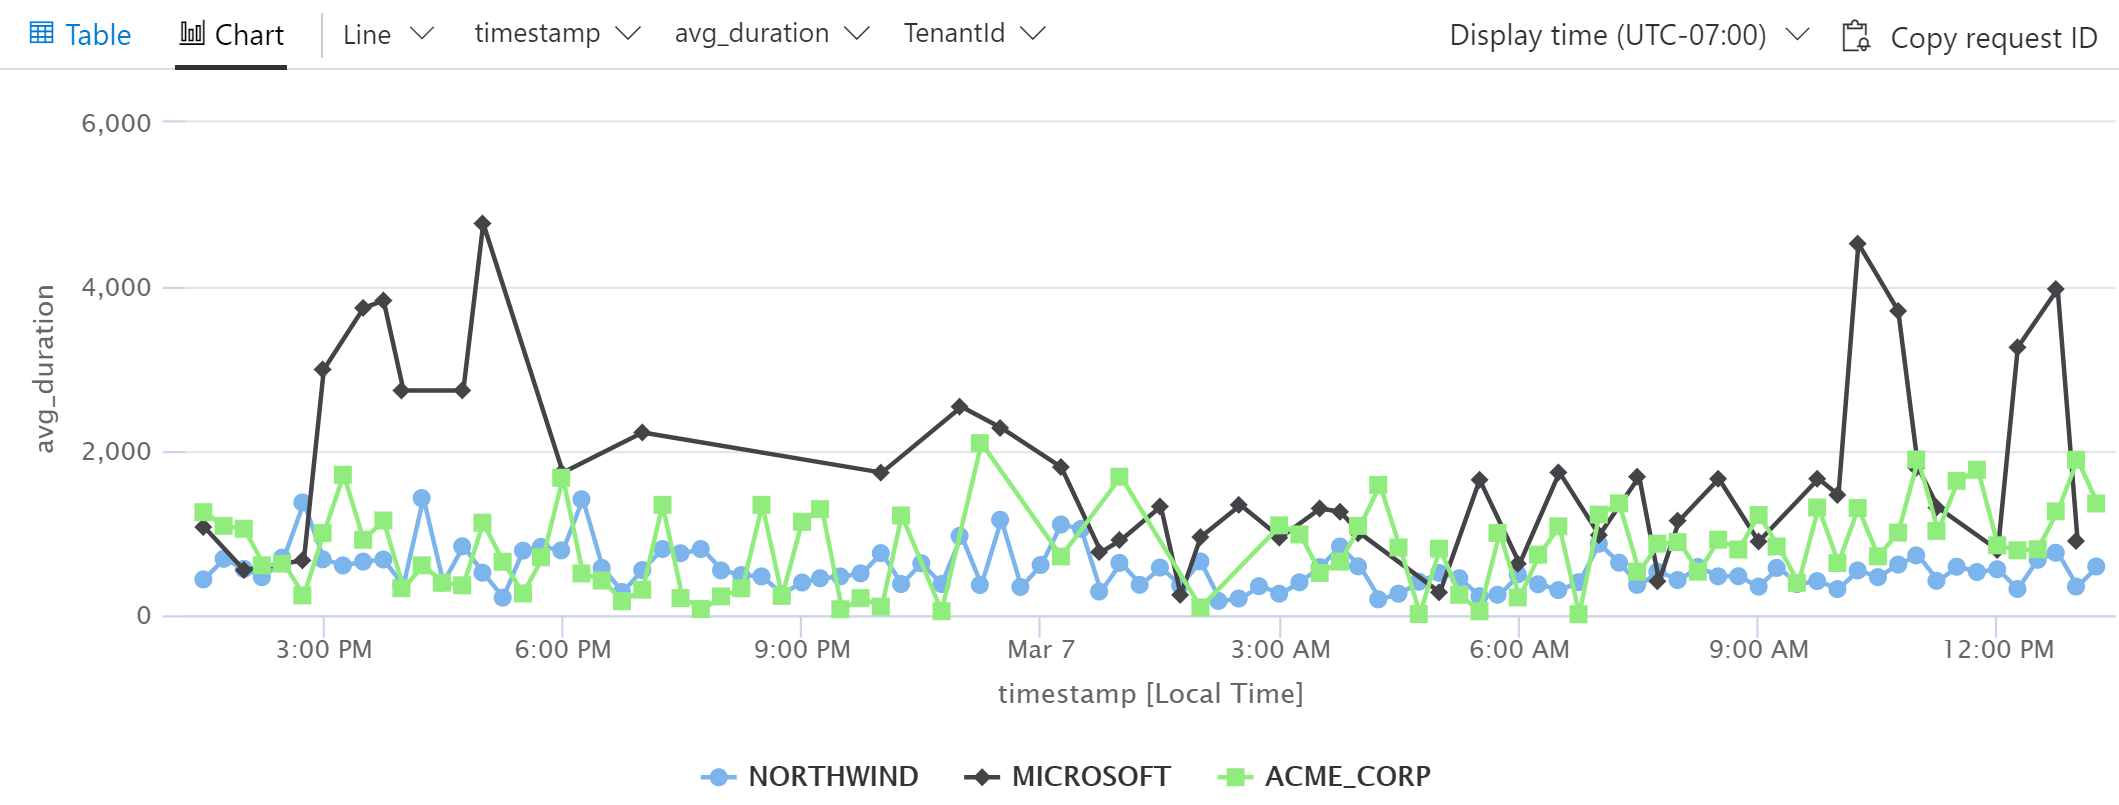
Small variations on this query can be extremely useful in comparing response times, failure rates, usage and pretty much anything else you can think of.
Wrapping it up
TenantId is just an example of a custom property. The custom properties that are useful for a particular application tend to emerge naturally as you’re investigating issues and sifting through telemetry in Application Insights. You will eventually find yourself saying “I wish I knew what xxx was for this request`. When that happens, stop and add that as a custom property to the request telemetry. You’ll thank yourself later.